
Bank Efficiency Ratio: The Carl Perkins Of Bank Due Diligence
6 min read
Three companies operate in the same sub-industry, experience the same market microevents, and offer virtually the same product. Company A’s expenses consume $52.16 of every $100 of operating income, leaving $47.84 in profit to fund shareholder distributions and share buybacks. Company B’s expenses consume $65.78 of every $100 of operating income, leaving $34.22 in profit to fund shareholder distributions and share buybacks. Company C’s expenses consume $81.35 of every $100 of operating income, leaving $18.65 in profit to fund shareholder distributions and share buybacks. Which company’s stock would you prefer to own? Much like the Rock and Roll Hall of Fame Carl Perkins is often overlooked by not receiving the recognition he deserves, so does a little employed tool which should be utilized when evaluating bank stocks. As a comparison tool of management’s ability to generate profits for shareholders, the efficiency ratio for banks should be an important consideration in investors’ bank analysis.

Simplistically, banks make money two ways – 1) the spread between the cost of generating capital, i.e. cash deposits and indebtedness, and the income produced by lending that same capital, also known as the net interest margin; and 2) fees for various financial services. The lowest cost means of generating additional capital for banks is to attract higher checking accounts deposits as these accounts typically pay lower interest (cost to the bank) than other forms of capital generation. The efficiency ratio is a quick reference point to evaluate the productivity of the bank’s operation. The most referenced formula is simple: Efficiency Ratio = (Expenses – Interest Expense) / Revenues. The higher the revenues in relation to non-interest expense, the more profits the bank usually makes. The ratio indicates how well the bank’s managers control their overhead, or “back office”, expenses. Generically, the threshold ratio is 50%, where banks with higher ratios are considered as less efficient as banks with efficiency ratios below 50%.
Efficiency ratios will move around from quarter to quarter. For instance, bankregdata.com screens the quarterly filings of financial institutions known as the Uniform Bank Performance Reports. The UBPR is a required filing complied by the Federal Financial Institutions Examination Council, a key government bank oversight body responsible for developing uniform reporting systems for federally supervised financial institutions. Bankregdata.com offers a subscription-based recap of the quarterly UBPR filings and publishes a list of the top 100 financial institutions’ quarterly results, including efficiency ratios. The examples at the beginning of the article were taken from the second-quarter results of Citi Group (C) at 52%, Bank of NY Mellon (BK) at 65%, and Wells Fargo (WFC) at 81%. On a year-to-date basis, these same banks generated efficiency ratios of 51%, 66%, and 74%, respectfully.
The table below shows the average efficiency ratio by quarter over the past three years for the top 100 financial institutions by assets. What is not shown is the range of the ratio in the most recent quarter from 38% on the low to 325% on the high.
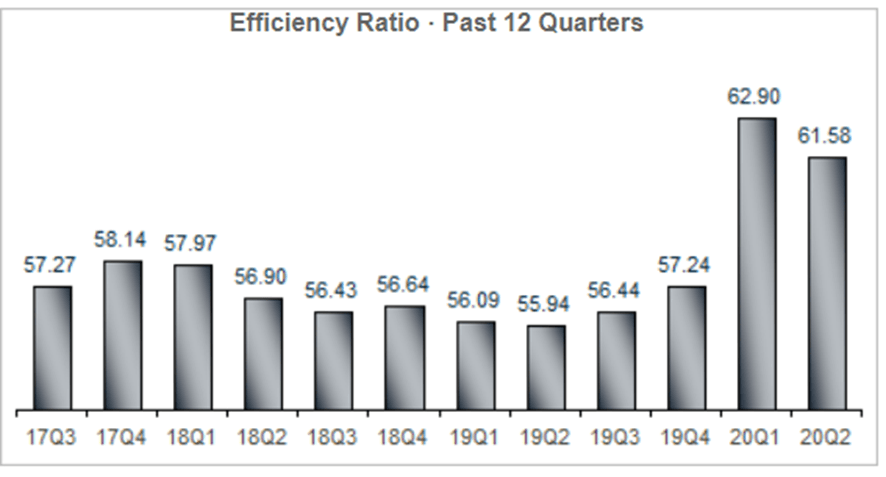
Source: Bankregdata.com
Bankregdata.com also offers the following year-to-date 2020 average efficiency ratio by financial institution asset size. 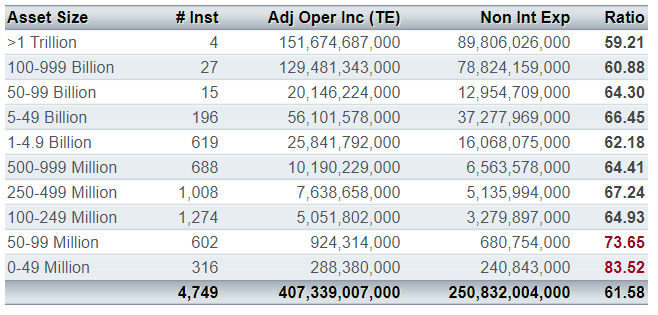
Source: Bankregdata.com
However, like much in the financial world, not all ratio formulas are exactly the same. In this instance, the “description” most used formula for efficiency ratio is as defined above:(Expenses – Interest Expense) / Revenues. The UBPR formula, as maintained by the banking overseers, is slightly different: Non-Interest Expense / Adjusted Operating Income TE (tax equivalent). The big difference is the first formula does not consider additions to loan loss reserves as part of the calculation while the second formula includes loan loss write-offs as part of the tax equivalent operating income calculation. Including loan loss write-offs creates a very different result with the ratio reflecting a higher value when loan losses are higher. The large increase in loan loss write-offs for this year is obvious in the spike in the average ratio for the first and second quarters of 2020. While textbook definitions are theoretical, the UBPR formula is what is used by governments’ oversight agencies and what most financial analysts publish.
In addition, it is important to review the efficiency ratio for similar financial firms. For example, American Express (AXP) is mainly a credit card company with a very different income profile than a regional or community bank. Morgan Stanley (MS) and Goldman Sachs (GS) are investment banks with substantial income from fees and commissions. When using the efficiency ratio as a fundamental analysis tool, it is important to compare financial institutions with similar business profiles.
The efficiency ratio is not a static number, as shown above, and is not a binary choice of either revenue/income or expenses. The concept of operating leverage is important when comparing efficiency ratios. Operating leverage is the relationship between revenue growth and expense growth, with positive operating leverage achieved when revenue increases faster than expenses and negative operating leverage describes the opposite, or when expense growth outstrips revenue growth. The article The Secret to a Low Efficiency Ratio in the May 2019 industry publication Bank Director has described the positive operating leverage as the most important and best kept secret to improving efficient ratios.
A real-life example is Phoenix-based Western Alliance Bancorp (WAL). The bank’s operating efficiency ratio in 2018 was an exemplary 41.9 percent. The management team places great importance on efficiency, although the bank’s expenses did rise last year. But this increase was more than offset by strong revenue growth, which exceeded expense growth by approximately 250 percent. This is a good example of positive operating leverage and it is the real story behind the bank’s low efficiency ratio. The greater the operating leverage, the lower the efficiency ratio because the ratio is relational. It is not solely a cost-driven metric. At Western Alliance and other banks that focus on creating positive operating leverage, it is not just how much you spend-it is how many dollars of revenue each dollar of expense creates.
Western Alliance Bank increased operating revenues by 13% in 2019 and generated an efficiency ratio of 42%, the same as 2018. WAL has generated a YTD 2020 efficiency ratio 38%, which has been fairly constant during the first two quarters of 2020.
In January, Forbes magazine lists its top 100 banking selections for the next year. Two of the criteria listed are the efficiency ratio and operating revenue growth, dovetailing nicely with the advice of the article linked above. The table below lists the top 15 banks by the lowest efficiency ratings, from the Forbes Best Banks List of 2020.
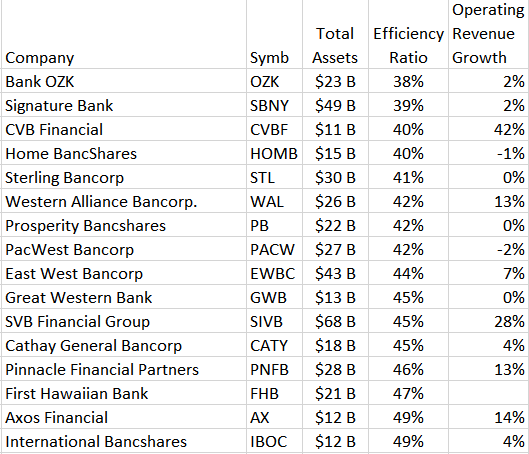
Source: Forbes, GMI
Below is a list of the largest US banks by total assets. The columns list the financial institutions’ rank by total assets, stock symbol, the number of employees, total assets, tax equivalent adjusted operating income, non-interest expense, and the efficiency ratio. The information is year-to-date as of June 2020. Left off the list are investment bankers and credit card firms as their income relies more heavily on fees and commissions.
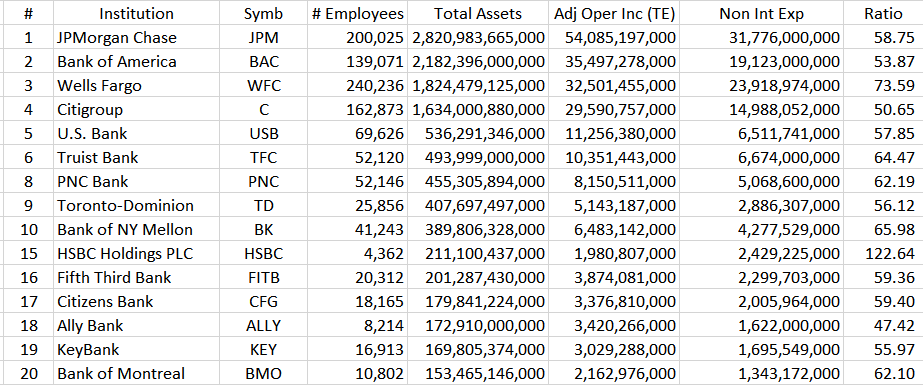
Source: bankregdata.com
While not the end-all be-all of bank stock due diligence, inclusion of the efficiency ratio and revenue growth for comparison could provide a bit more clarity into managements’ ability to reward investors. Much like the genius of Carl Perkins is overlooked by many music enthusiasts, these readily available fundamental tools are missing from most investors’ bank reviews.
Addendum. One of the original “Rockabilly” artists blending a southern country sound with the emerging beat of rhythm and blues, Carl Perkins wrote some of the most enduring rock and roll songs of the late 1950s to 1970s. His first big hit was Blue Suede Shoes, and an interesting link to a 1956 Perry Como Show performance that while most likely lip synced is a great example of the song as originally written and recorded. In 1971, Perkins performed Matchbox on the Johnny Cash Show with Cash and Eric Clapton. Matchbox is Perkin’s take on the tune Matchbox Blues by Blind Lemon Jefferson. The Beatles recorded more Carl Perkins songs than any other artist and Paul McCarthy is quoted as saying, “If there were no Carl Perkins, there would be no Beatles.” One of Perkins/Beatles hits was Honey Don’t. In addition, Perkins adapted and popularized the previously little-known Rex Griffin 1936 tune Everybody’s Trying To Be My Baby. Most intriguing is the one-time 1956 jam session with Elvis Presley, Johnny Cash, Jerry Lee Lewis, and Carl Perkins, known collectively as The Million Dollar Quartet. From that session came a rendition of I Shall Not Be Moved. Enjoy.
Disclosure: I/we have no positions in any stocks mentioned, and no plans to initiate any positions within the next 72 hours. I wrote this article myself, and it expresses my own opinions. I am not receiving compensation for it (other than from Seeking Alpha). I have no business relationship with any company whose stock is mentioned in this article.